

Story by Philip van Doorn |MarketWatch.com| Oil demand is likely to hold up longer than many people expect during the anticipated transition to electric vehicles. And changes in the industry point to oilfield services companies as good long-term growth investments as offshore production ramps up.
Below is a list of oil producers and related companies favored by two analysts who have followed the industry for decades.
U.S. oil companies continue to follow a “once bitten, twice shy” strategy of being careful with their cash. They don’t want to experience a repeat of the slide in oil prices from mid-2014 through 2016 that pushed some producers and related companies into bankruptcy. That price decline resulted from an increase in supply amid the euphoria of the golden age for U.S. shale oil production.
Let’s set the stage with two charts. The first chart shows the movement of front-month price contracts for West Texas Intermediate crude oil CL over the past 10 years:
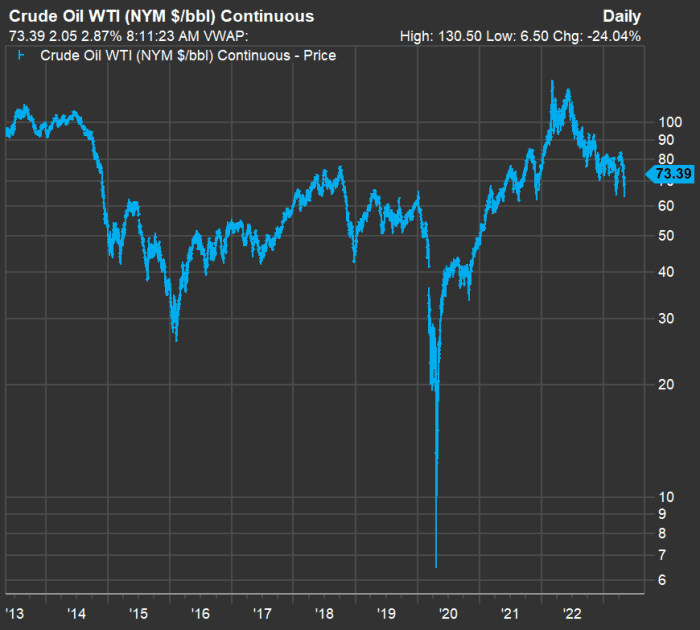
FACTSET
The plunge in oil prices during the early stage of the COVID-19 pandemic was quickly reversed. Enough said.
Now here’s an updated chart shared by Sam Peters, a portfolio manager at ClearBridge Investments in New York, showing the movement of estimated energy industry capital expenditures on oil exploration, source development and production against the level of U.S. inventories from 2004 through 2022:
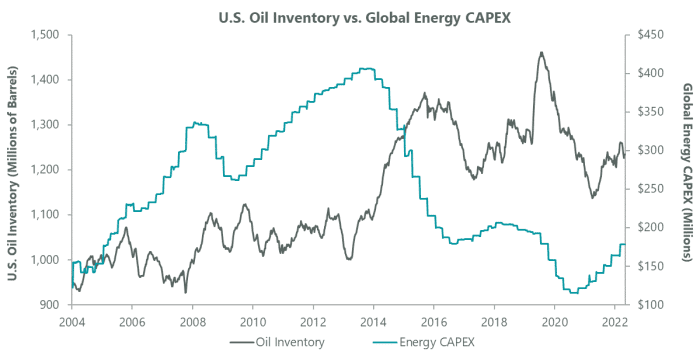
As of Dec. 31, 2022. Source: ClearBridge Investments, Bloomberg Finance LP, IEA.
READ NEXT: 14,000 Oil & Gas Wells Remain Unplugged
On the left, the chart shows that capital expenditures had increased when supplies were low. On the right side of the chart, starting in 2019, you can see a dramatic decline in capital expenditures when inventories began to decline. Expenditures picked up during 2022, but it still appeared to be a period of underinvestment.
Simon Wong, an analyst covering the energy sector at Gabelli in New York, expects continued price volatility for oil stocks this year, because of the price decline from last year. He expects less cash to be distributed through special dividends and buybacks.
But for the long term, he is “pretty optimistic about offshore growth,” because U.S. shale production has become more difficult, with lower yields on newer wells and a general lack of willingness to spend on production. After years of subdued investment, offshore explorers, drillers and services companies are increasing investment, he said. “Unless oil prices significantly collapse, many of these projects will move forward despite the volatility in commodity prices,” Wong added.
Peters, who co-manages the ClearBridge Value Trust LMNVX and the ClearBridge All Cap Value Fund SFVYX, agrees with both points. “It is not just that there is discipline in shale, it is that well-productivity in shale is getting worse,” he said during an interview. During “the shale boom era” of 2000 through 2014, “if you took the barrels of oil that were brought on by shale in the U.S. and the natural gas, you brought on the energy equivalent of two Saudi Arabias,” he said.
And he doesn’t expect to see a repeat for U.S. production.
 Among offshore drillers and oilfield services companies, Wong favors Schlumberger N.V. SLB, Weatherford International PLC WFRD, Halliburton Co. HAL, TechnipFMC PLC FTI and Oceaneering International Inc. OII.
During the collapse of oil prices from mid-2014 through early 2016, “most of the offshore drillers went bankrupt and most of the equipment was destroyed,” Peters said. “So capital spending is rising and the offshore drillers have pricing power.”
When asked about the long-term outlook for oil prices amid the energy transition, Peters said the current world daily oil demand was likely to be close to the current level of 100 million barrels a day in 2030, even with electric vehicles removing about 1.5 million daily barrels of demand so far and “another five to eight million” by 2030.
If demand holds steady and Wong and Peters are correct about the domestic shale outlook, investors may be looking at a good long-term opportunity, if they are patient.
Peters said within the two funds he co-manages, he had “rotated to offshore services” in December, when ClearBridge became a large shareholder of Noble Corp. PLC NE. According to FactSet, funds operated by ClearBridge hold a 1.12% stake in Noble’s common shares. This makes ClearBridge the 14th largest institutional shareholder.
Peters also said he had taken a position in shares of Hess Corp. HES, which has offshore production assets in Guyana, operated by Exxon Mobil Corp. XOM. When asked if he had also invested in Exxon Mobil, Peters said no, because the project is much more meaningful for Hess. He expects Hess to be one of the most rapid free-cash-flow growers among the S&P 500 SPX over the next five years. A company’s free cash flow is its remaining cash flow after capital expenditures. It is money that can be used for expansion or to pay dividends or repurchase shares, or for other corporate purposes.
Here’s a set of consensus estimates for all the stocks mentioned in this article favored by Wong and Peters, plus Exxon Mobil, through 2025, among analysts polled by FactSet. All tables are in the same order, by which the companies were mentioned above.
First, annual sales:
| Company | Ticker | Estimated 2023 sales($mil) | Estimated 2024 sales($mil) | Estimated 2025 sales($mil) | Two-year estimated sales CAGR through 2025 |
| Schlumberger N.V. | SLB | $33,047 | $36,584 | $40,575 | 10.8% |
| Weatherford International PLC | WFRD | $4,965 | $5,426 | $5,540 | 5.6% |
| Halliburton Co. | HAL | $23,698 | $25,945 | $27,776 | 8.3% |
| TechnipFMC PLC | FTI | $7,493 | $8,456 | $9,610 | 13.2% |
| Oceaneering International Inc. | OII | $2,318 | $2,465 | $2,528 | 4.4% |
| Hess Corp. | HES | $10,603 | $12,799 | $13,470 | 12.7% |
| Noble Corp. PLC Class A | NE | $2,417 | $2,928 | $3,215 | 15.3% |
| Exxon Mobil Corp. | XOM | $368,388 | $354,056 | $336,031 | -4.5% |
| Source: FactSet | |||||
Click on the tickers for more about each company or index.
Click here for Tomi Kilgore’s detailed guide to the wealth of information available for free on the MarketWatch quote page.
Schlumberger, TechnipFMC, Hess and Noble are all expected to grow sales at a double-digit compound annual rate through 2025. Only Exxon is expected to show a sales decline.
Here are earnings-per-share estimates for the group:
| Company | Estimated 2023 EPS | Estimated 2024 EPS | Estimated 2025 EPS | Two-year estimated EPS CAGR through 2025 |
| Schlumberger N.V. | $3.01 | $3.70 | $4.44 | 21.6% |
| Weatherford International PLC | $4.66 | $6.21 | $6.39 | 17.1% |
| Halliburton Co. | $3.09 | $3.64 | $4.25 | 17.3% |
| TechnipFMC PLC | $0.47 | $1.02 | $1.67 | 88.7% |
| Oceaneering International Inc. | $0.93 | $1.35 | $1.96 | 45.4% |
| Hess Corp. | $5.35 | $9.01 | $10.73 | 41.7% |
| Noble Corp. PLC Class A | $2.52 | $5.16 | $6.78 | 64.1% |
| Exxon Mobil Corp. | $10.29 | $9.69 | $9.60 | -3.4% |
| Source: FactSet | ||||
The high EPS growth rates underline how margins improve once sales hit a certain level.
Consensus estimates for free cash flow per share aren’t available for all of the companies through 2025, and the 2023 estimate for Hess is negative:
| Company | Estimated 2023 FCF | Estimated 2024 FCF | Estimated 2025 FCF | Two-year estimated FCF CAGR through 2025 |
| Schlumberger N.V. | $3.02 | $3.93 | $6.25 | 43.9% |
| Weatherford International PLC | $3.83 | $4.47 | N/A | N/A |
| Halliburton Co. | $2.26 | $2.34 | N/A | N/A |
| TechnipFMC PLC | $0.80 | $1.40 | $2.69 | 83.2% |
| Oceaneering International Inc. | $1.16 | $1.05 | N/A | N/A |
| Hess Corp. | -$1.51 | $3.82 | $5.67 | N/A |
| Noble Corp. PLC Class A | $1.36 | $3.73 | N/A | N/A |
| Exxon Mobil Corp. | $9.52 | $10.43 | $11.27 | 8.8% |
| Source: FactSet | ||||
Finally, here’s a summary of analysts’ opinions about these stocks:
| Company | Share “buy” ratings | Share neutral ratings | Share “sell” ratings | Consensus price target | May 5 closing price | Implied 12-month upside potential |
| Schlumberger N.V. | 94% | 6% | 0% | $64.74 | $45.75 | 42% |
| Weatherford International PLC | 86% | 0% | 14% | $90.00 | $60.79 | 48% |
| Halliburton Co. | 96% | 4% | 0% | $48.08 | $29.88 | 61% |
| TechnipFMC PLC | 89% | 11% | 0% | $18.73 | $14.25 | 31% |
| Oceaneering International Inc. | 50% | 50% | 0% | $22.00 | $17.04 | 29% |
| Hess Corp. | 56% | 37% | 7% | $163.27 | $136.30 | 20% |
| Noble Corp. PLC Class A | 91% | 9% | 0% | $56.00 | $37.09 | 51% |
| Exxon Mobil Corp. | 48% | 49% | 3% | $128.50 | $108.68 | 18% |
| Source: FactSet | ||||||
It is important to keep in mind that ratings among analysts who work for brokerage firms are typically based on their 12-month outlook for the shares. Investors, such as Peters and Wong have longer-term horizons.
The data above might serve as a starting point for your own research. [Original Story]

