

Investopedia – by Gary Ashton ~ Oil had another bumpy week and closed 3.2% lower, with Monday making up most of the weekly loss. Markets are worried about the state of the global economy after President Trump upped the ante in the U.S. trade dispute with China. The president said on Friday that he was ready to impose tariffs on all $500 billion of U.S. imported goods from China in a major escalation to the clash over trade policy that has unnerved financial and commodity markets.
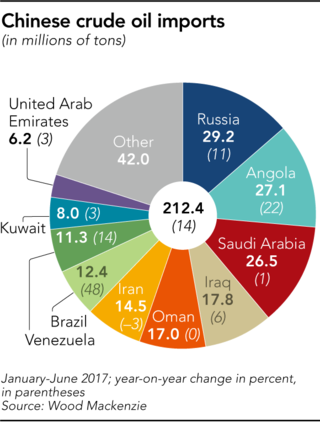
News of rising trade tension came at the same time Platts reported that China posted a reduction in crude oil imports for the first time in 2018. China’s imports of crude oil slowed in the second quarter of 2018 and could slow further in the second half of the year. In June alone, imports fell nearly 5% compared with a year earlier. The chart below from Wood Mackenzie shows where China sources its oil. Slowing oil demand from China is likely to be an essential bearish oil price narrative in the months ahead.
Plentiful Global Oil Supply
Market concerns about rising oil supplies prompted Saudi Arabia to make an official statement that it is not seeking to oversupply the market. Recently, U.S. President Trump demanded that OPEC do something about high oil and domestic gasoline prices by increasing production. Last month, OPEC+ members agreed to increase oil production by 1.0 million barrels per day (mbpd) in 2018. A top Saudi official said last week that Saudi oil production would remain flat in July compared with June at 10.5 mbpd.
Meanwhile, global oil supplies continue to rise, with the U.S. reporting record oil output. Oil production recently hit 11 mbpd, a new record high. A separate EIA report predicts that shale oil output will grow by another 143,000 barrels per day (bpd) in August compared with July. Gains will come from the Permian (+73,000 bpd), the Eagle Ford (+35,000 bpd) and the Bakken (+15,000 bpd), plus smaller contributions from elsewhere.
Increased U.S. Oil Exports
To help find additional markets for rising U.S. shale oil production, Enterprise Products Partners L.P. (EPD) said it plans to construct an oil export terminal and dock 80 miles off the Texas coastline that can accommodate the world’s largest crude-carrying vessels. The dock would be extended out from the coastline into deeper waters, and the project could cost $1 billion to $2 billion and take several years for the company to complete.
Plans to export oil from Texas come as the Intercontinental Exchange plans to debut a physically delivered Permian West Texas Intermediate crude oil futures contract that is settled and delivered at Magellan Midstream Partners, L.P.’s (MMP) terminal in Houston. Texas oil output is rising so quickly that investment bank HSBC said Texas, with projected oil production of 5.6 mbpd, is on track to surpass Iran and Iraq to become the world’s third largest oil producer in 2019.
Technical Picture Turns Cloudy
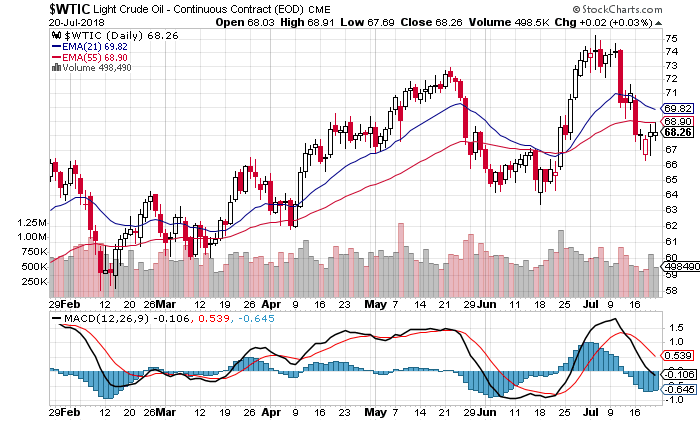
Oil’s technical picture looks bearish on the daily chart. Seven out of nine technical indicators are signaling a sell, with two signaling neutral and none signaling buy. The moving average picture continues to deteriorate, with three near-term and one mid-term average signaling sell against two long-term averages signaling buy.
Additionally, the fast line of the moving average convergence divergence (MACD) momentum indicator is now below zero, indicating that momentum has shifted to the downside. Confirmation of further downward price action could come with the 21-day exponential moving average crossing the 55-day exponential moving average over the next several trading days.
The longer-term weekly price chart is more positive, with four buys, two sells and four neutral technical indicators. Moving averages are also more favorable, with only the five- and ten-week averages signaling sell.
However, oil is entering a bearish reversal pattern that traders call a “three outside down” candlestick pattern on the weekly price chart. This pattern is an engulfing bearish reversal in which the third candle is a down one with a lower close than the second candle. The third candlestick tends to be confirmation of the bearish trend reversal. Traders also see this pattern as more reliable because it occurs on a higher time order (weekly) chart. These higher timeframes tend to show emerging trends more clearly than lower time order charts.
Disclaimer: Gary Ashton is an oil and gas financial consultant who writes for Investopedia. The observations he makes are his own and are not intended as investment or trading advice. Price chart courtesy of StockCharts.com.

